Cancer Quality of Life Survey
About the survey
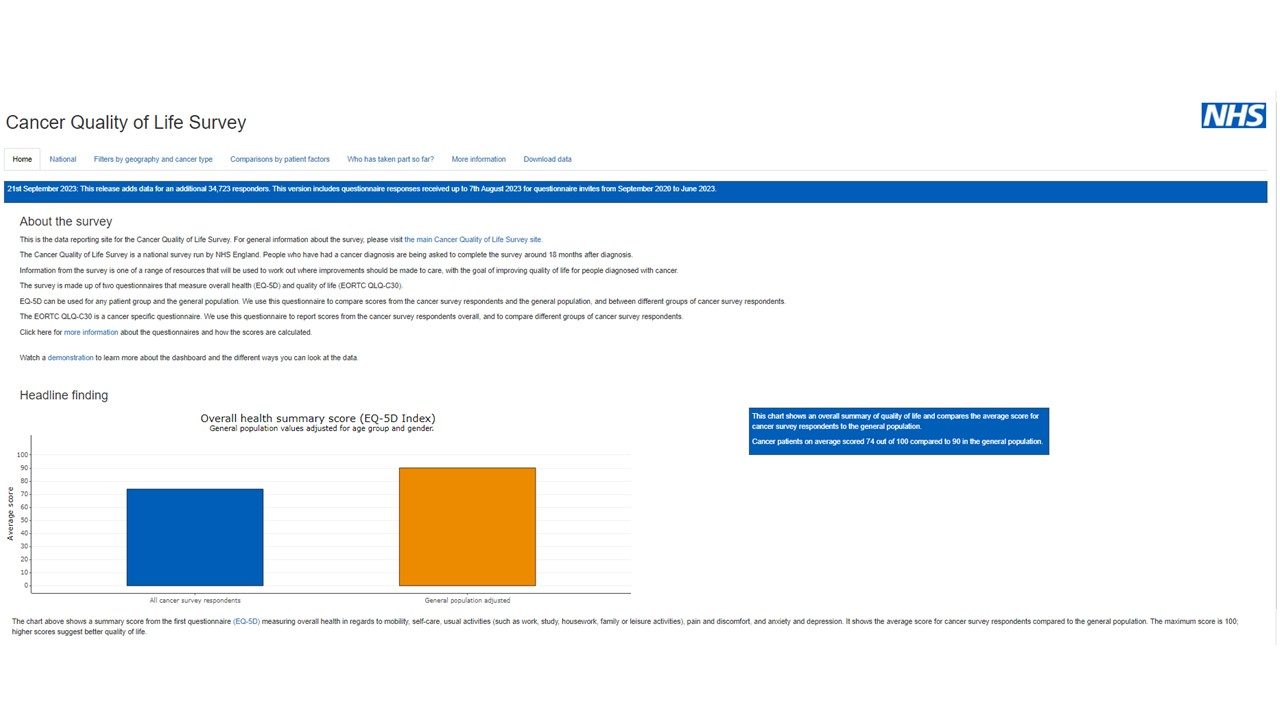
This is the data reporting site for the Cancer Quality of Life Survey. For general information about the survey, please visit the main Cancer Quality of Life Survey site.
The Cancer Quality of Life Survey is a national survey run by NHS England. People who have had a cancer diagnosis are being asked to complete the survey around 18 months after diagnosis.
Information from the survey is one of a range of resources that will be used to work out where improvements should be made to care, with the goal of improving quality of life for people diagnosed with cancer.
The survey is made up of two questionnaires that measure overall health (EQ-5D) and quality of life (EORTC QLQ-C30).
EQ-5D can be used for any patient group and the general population. We use this questionnaire to compare scores from the cancer survey respondents and the general population, and between different groups of cancer survey respondents.
The EORTC QLQ-C30 is a cancer specific questionnaire. We use this questionnaire to report scores from the cancer survey respondents overall, and to compare different groups of cancer survey respondents.
The Quality-of-Life Survey
Improving Cancer Patient Support
The project was initiated when NHS England, working in association with Macmillan, the East of England Cancer Alliance and four other pilot sites implemented a quality-of-life indicators questionnaire for cancer developed by the European Organisation for Research and Treatment of Cancer (EORTC). This questionnaire, based on European and international best practice, was designed to provide information and insight as regards the quality-of-life of cancer patients during and after treatment. After the pilot phase it has become an ongoing national study. At this early stage, Suffolk and North East Essex ICB working in partnership with the Strategic Intelligence Alliance in Healthcare (SIA) which had experience in Perception Profile Modelling, undertook a new phase of this project. This resulted in a Quality-of-Life Indicator (QOLI) Executive/Business Intelligence model developed using Microsoft Power BI, the results of which were shared with the Cancer Quality of Life Working Group via regular monthly video conference. This is where things stared to get exciting as the Working Group, consisting of NHS Managers, Administrators, Nurses, Clinicians, Project Managers and Business Intelligence specialists began working together effectively to support and improve our patient’s quality-of-life.
Alan Bateman, our Project Lead, requested NHS England to provide us with our own extract from the National Dataset covering the East of England in more detail than available from the National Model. Although obviously still fully anonymous and only covering the 3 main cancer types (Breast, Colorectal & Prostate), our new local dataset provided actual response scores by question rather than aggregations by different groups of patients.
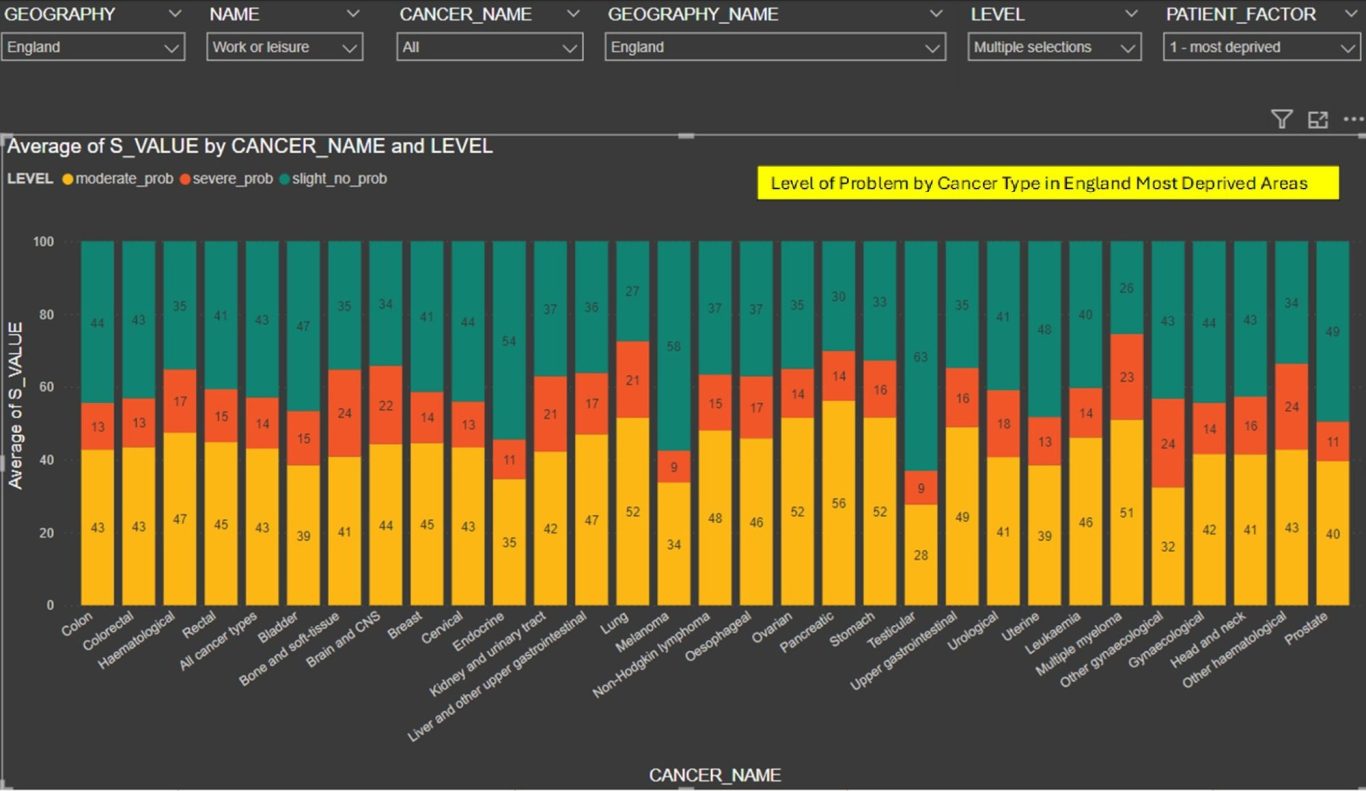
Whilst we do only have the three most significant cancer sites broken out, we do also have all the other responses from every patient grouped under the category of "other." Not ideal, but we expect it gradually to breakdown into the other cancer types when the numbers are greater, but anonymity issues prevent this right now. However, this opened up a lot of new possibilities including worst and least case issues by cancer type, and the impact of different factors on the quality-of-life perception scores. It also provided a dataset capable of being analysed by our Power BI Model’s Key Influencer Analysis, a Power BI Artificial Intelligence (AI) function, used to identify which question scores influenced other question scores, Frailty being a good example.
It also allowed us to project the actual numbers of patients affected by the different issues. This in turn allowed us to investigate needs regarding service improvement and how we support business cases. Some examples of this are: -
- We can be confident (because it’s the patients that have told us directly by answering the QOL questionnaire) there are about 285 patients needing a Frailty service that the Trust is putting in place with the Frailty clinic.
- We can be confident that a figure of 1,300 is closer to the potential demand for counselling services across the Trust for appropriate support services for patients within 5 years of diagnosis.
- We found that the current estimate of Late Effects Radiotherapy patients in ESNEFT & West Suffolk is approximately 958.
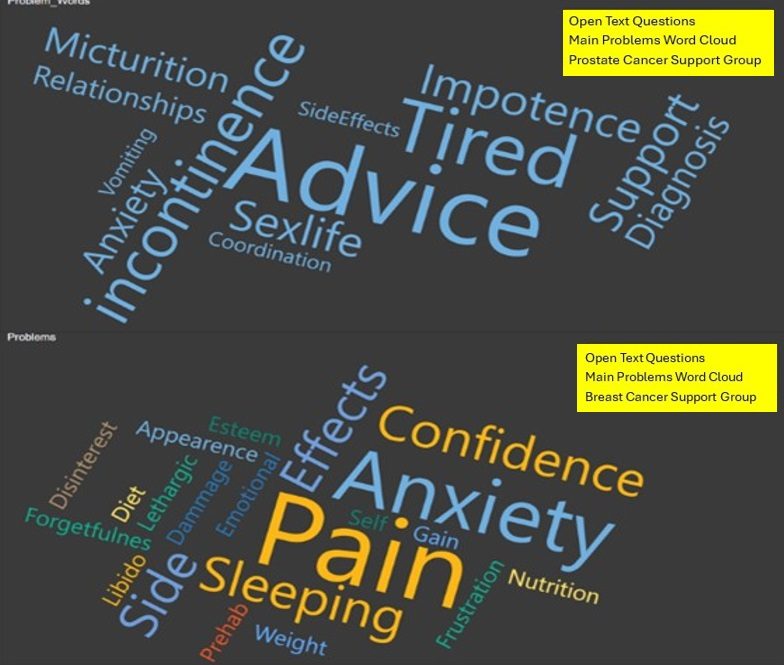
As we progressed over time, we decided that a good understanding of quality-of-life perceptions could be established from a combination of two models, one covering the National Dataset and one covering our own Local dataset as provided by NHS England. As we continued sharing our analysis and suggestions with other stakeholders, we realised that our current modelling only covered patients who had completed their treatment some 18 months ago and we were picking up feedback that our understanding would be greatly improved if we could include patients currently undergoing treatment. This was discussed via frontline members of the Working Group with some of our Cancer Patient Support Groups, specifically Urology, Breast, Prostate and Lung cancer.
The idea of involving our patients through their support groups with modelling their answers to the questionnaires was well received and adopted. So, we have now added a third anonymised model covering our support groups. Essentially, this model provides an analysis and visualisation of question scores relating to the specific cancer type of the support group. This has allowed us to identify the main strengths and weaknesses associated with current cancer services by cancer type. This is fed back via presentations of the model results to support group patients for their views and to demonstrate the value of their contribution. During these presentations, a valid concern was raised: if there isn’t a question specifically addressing an important issue, the current process might fail to identify it. Interestingly, this issue had previously been discussed by the Working Group and three simple Open Questions designed to address it. However, at the time it was felt that subsequent meaningful analysis might be technically difficult as we would be dealing with free text rather than numbers.