

Patient Discovery & Early Diagnosis
QOF Based & Referral Based Methodologies
Early Diagnosis Modelling Improving Cancer Outcomes in 2021
Early diagnosis and treatment is one of the best ways to avoid significant down the road problems, costs and most importantly worse patient outcomes. Thanks to NHS Digital, now part of NHS England, nearly all the data you would need to develop and run early diagnosis strategies is now available under "Open Government License".

Working together to improve patient outcomes

Improving Cancer Outcomes in 2021
During 2020 we all discovered how vulnerable our cancer services become when our health service is overwhelmed by a major health emergency - COVID_19. Working with NHS colleagues, our approach has been to focus on creating from available datasets a range of tools, which are either directly actionable, or can form the basis for a set of action plans:
These encompass the following:
- Building of critical KPI based LoCATE monthly updated model for East of England Cancer Alliances with a view to sharing the IP with other Cancer Alliances across NHS England
- Creation of a generic overview methodology at population levels by adapting established pharma style Comparative Proportionality Segmentation techniques for substantiated patient discovery & early diagnosis.
- A specific set of analytics on individual cancer types, using breast cancer as an initial paradigm, to accelerate early diagnosis through primary and secondary care settings. This is in effect “scanning” GP referral data and disease demographics, which show considerable variance in diagnosis effectiveness.
- An analysis of Outcomes questionnaires on Quality of Life, indicating where and what types of support is or may be needed and to place this in a consistent format to allow for clinical follow up
We have also added AI/ML expertise to complement our health intelligence methodologies, based on our current work with Imperial College on the National Neonatal Database.
Each of these are powerful and necessary tools, but by putting Early Diagnosis, Performance and Quality of Life analyses together, you gain a picture of the entire patient pathway. This allows for a level of analysis that is holistic and greater than the sum of its parts. With clinical and operational expertise, you can quickly identify areas of greatest concern and implement an action plan designed to rectify specific problems effectively, whilst also identifying areas of best practice. This evidence-based analysis can then be rapidly disseminated across the entire system. In addition, it is possible (and advisable) to monitor the effect such insights were having on individual areas, to maximise system efficiency.
Real-World Evidence and Early Diagnosis of Cancers
Towards the end of 2019 the SIA and associates completed a generic cancer early diagnosis model. It was understood that a generic model provided a means of starting to improve early diagnosis, whilst developing a programme focusing on individual cancer types. Our subsequent objective was to develop a methodology, define data requirements and produce an example health intelligence model for one cancer type as an example for evaluation purposes.
To date, we have completed pilot models for breast cancer and urological Cancer, using GP referral data for two week waits for both cancer types, noting that similar data is available for the other major cancer types. We believe that this can produce an accurate reflection of early diagnosis performance because 2 weeks wait data is readily accepted as a measure of suspected cancers. In fact, Professor Mark Lawler, Data-CAN’s-scientific lead, recently published an article which made the point that 2 week waits or red flag referral times for cancer are our early warning system to confirm or dismiss the suspicion of cancer.
Unlike the generic model, where it was necessary to use analogues such as obesity, deprivation, & age to define potential patient populations, we developed an approach which uses a combination of actual GP referral data and patient lists filtered according to the disease demographic, which should provide an accurate reflection of early diagnosis performance (Number of Referrals /Potential Population).
We believe that the following analyses and visualisations extracted from the model can help NHS organisations in improving early diagnosis of cancer generically. In consideration of our current development programme on particular cancer types i.e. Breast & Urological Cancer, we are now in a position to address these specifically using our eRefferal by Population model. However the generic model and the preliminary findings of modelling Breast & Urology show that there is a considerable variation in performance between CCGs nationally and even within similar areas.
Generic Model
The generic model’s objective is to improve early diagnosis of Cancer in Primary Care using Comparative Proportionality Segmentation Analysis to help identify diagnosis anomalies between GP Surgeries of similar character. It uses a simple logical approach to indicate referral effectiveness by comparing the registered number of Cancer patients at a Surgery with other factors known to affect Cancer prevalence. The primary generic features are:
- GP Surgery level indicators - designed to identify the expected proportion of patients registered as having the disease in consideration of relevant demographic factors.
- GP Surgery register - for the disease.
- League tables & Red, Amber, Green (RAG) Map - showing high, average, and low registrations based on actual GP Registers compared to the model outputs.
The Patient Discovery hypothesis assumes that the prevalence of Cancer should broadly be proportionate to the levels of Obesity, Patients 70 and over [age], & locality deprivation (as a proxy for lifestyle issues). This methodology works on the principle that the proportion of patients having any specific health condition will be relative to the proportion of patients affected by relevant demographic factors likely to influence or be influenced by that condition.
Red = Diagnosis of Cancer Patients is below the expected level for this specific surgery.
Amber = Diagnosis of Cancer Patients is within the median bounds for this specific surgery.
Green = Diagnosis of Cancer Patients is above the median bounds for this specific surgery.
This approach and model can easily be modified to address early diagnosis issues in other cancer types. Obviously, our cancer types specific models currently in development will be more accurate.
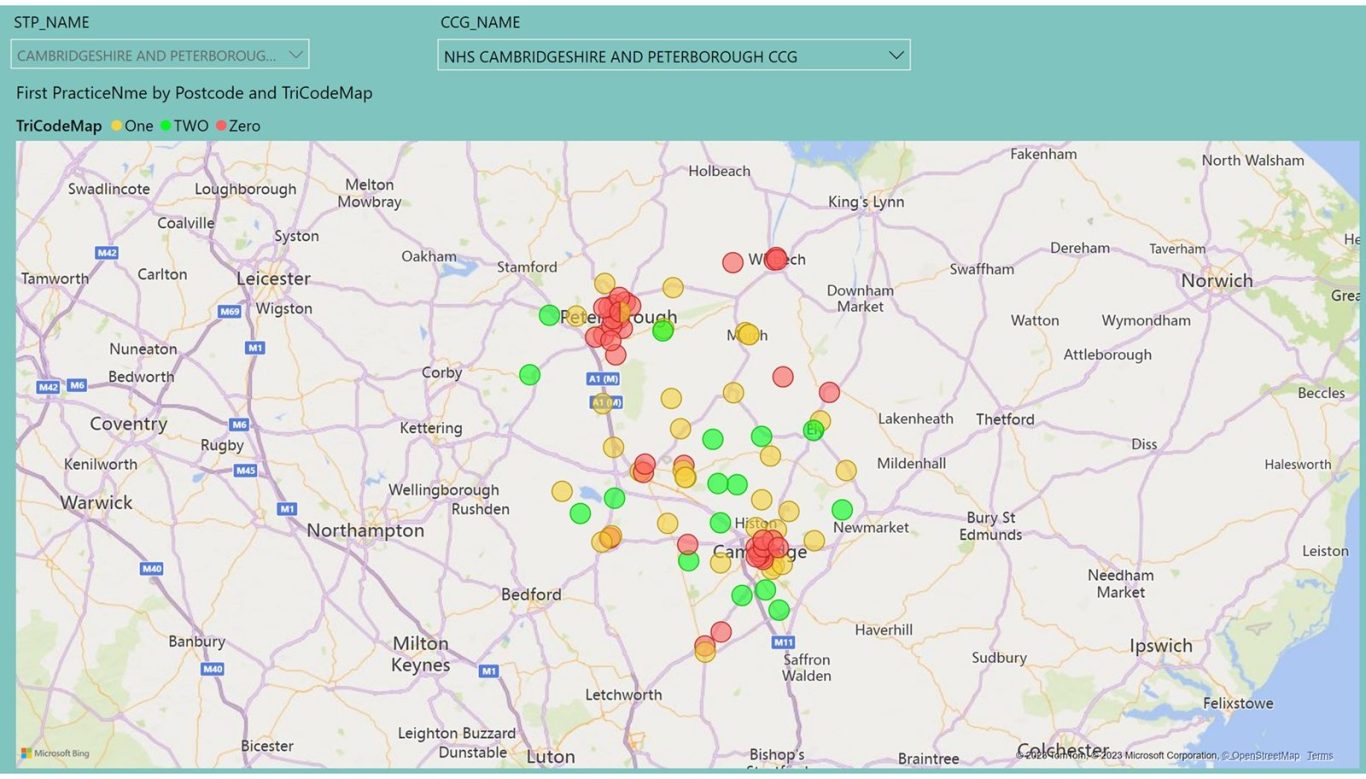
Early Diagnosis by Cancer Type - eReferral by Population and Needs Index
Action Plans & Implementation
Patient Audits (Identify High Risk Patients Narrative Medicine Practice GP’s, Nurses)
- Patient Audits (Identify High Risk Patients from Practice Database)
- Web Consultations (GP Support is available from retired GP network)
- Face to Face Consultations (Retired GP Support)
- ID Possible High-Risk Patients from Recent Face to Face Consultations
- Leverage Narrative Medicine Approach
- Ensure Best possible 2WW Referral Performance (Standard 93% within 14 Days)
- Ensure Best possible Diagnostic Imaging Performance
- (Achieve high number of tests and minimum number of days between Request to Test and Test Results)
Please note that both Patient Discovery and Early Diagnosis Models and Methods can be applied to most other health conditions.
Early Diagnosis
Type 2 Diabetes
Early diagnosis & GP Prescribing patterns affect down-the-road hospital admissions for diabetes with serious complications. With the advent of Integrated Care Systems, integrating primary and secondary care, it is hoped that these issues will now be addressed across England. Thanks to NHS Digital/England, we have the data to model diabetes diagnosis & treatment to inform decisions, improve outcomes and reduce costs.
Type 2 diabetes represents one of the major problems for our NHS organisations. It provides the perfect opportunity for different approaches to develop regarding levels of investment in prevention, early diagnosis & appropriate primary-care prescribing, where a higher investment can result in considerably reduced hospital costs associated with the more serious effects of the disease. Historically, with the primary care medicines budget held by clinical commissioning groups and the secondary care budgets by hospitals, there was little incentive for primary care to invest too heavily, since the benefits would not be seen at primary care level.
This has allowed a postcode lottery to build up over the years between NHS organisations prepared to invest in prevention, early diagnosis, and modern more expensive drugs and those not.
Power BI Computer Model:
In order to identify health conditions that may influence diabetes, we use the GP Practice QOF Disease Registers within Power BI’s and use its artificial intelligence and machine learning functionality to identify Key Influencers on Diabetes. This currently identifies Hypertension, Obesity and Chronic Heart Disease as the main ones.
Key Influencer Analysis
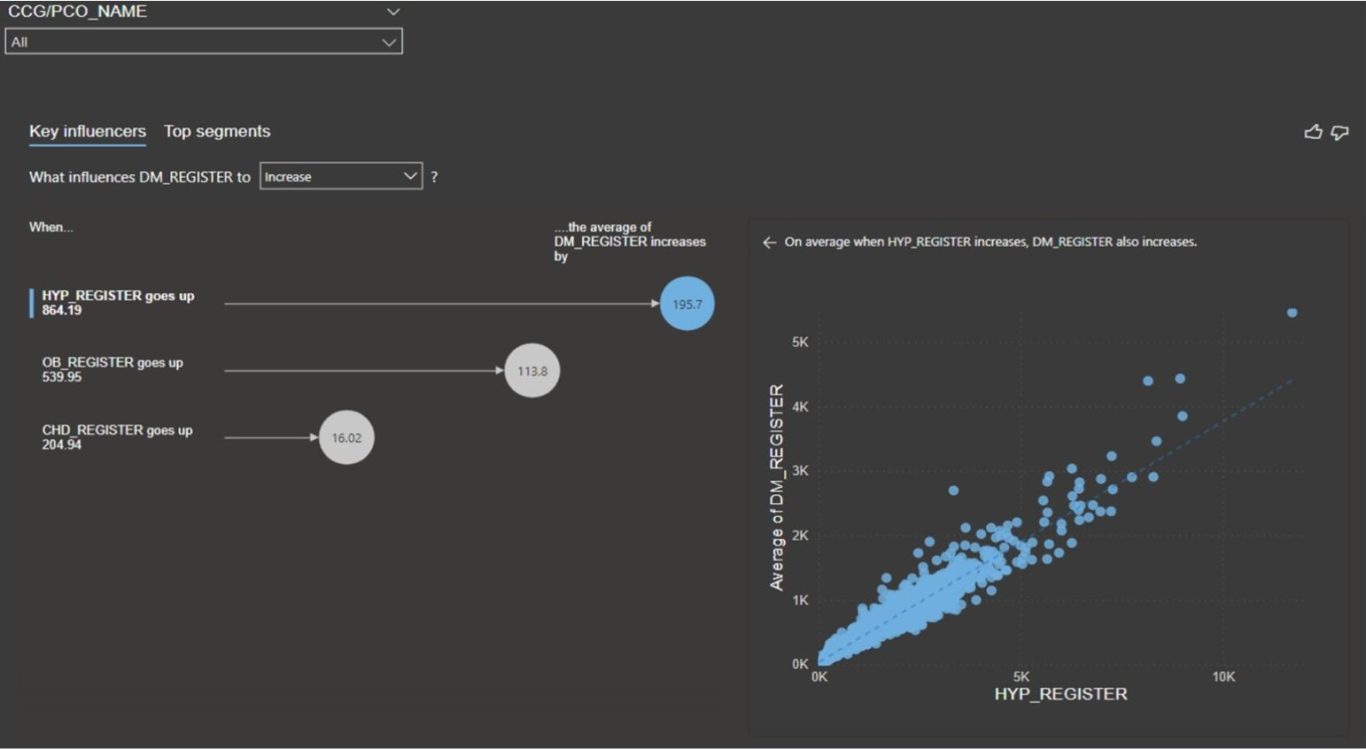
This does not mean they are causal but that there is a strong relationship between the patient numbers of these and diabetes patients. From this we can create an index based on these Key Influencers, which can be used to predict an approximate appropriate number for Diabetes patients relative to its Index. This can be achieved in a number of ways, but a common approach is to place each GP Practice in quintiles appropriate to its scores for Hypertension, Chronic Heart Disease, Obesity and then use the average for the index. Due to the known corelations, we can predict that an Early Diagnosis Index of Quintile 5 should equate to Quintile 5 for Diabetes, and we can rank GP Practices accordingly.
Diabetes Early Diagnosis Index - Methodology and Calculations
This model uses a targeting and segmentation methodology, commonly used within the pharmaceutical industry to target undiagnosed patients with an early-stage health condition likely to benefit from a new drug or treatment. The calculations are based on practice disease registers, local conditions, and disease demographics, indicating the likely incidence of the appropriate disease (Diabetes). These data are used to define risk factors by calculating the average score for each risk factors appropriate to all GP Practices. This is simply the total of the risk factor scores divided by the number of risk factor scores. These scores are represented by Quintile values 1 to 5 with a score of 5 equivalent to a high population and 1 to low. The early diagnosis index for Diabetes is simply a calculation of the Diabetes indicator (Quintile 1 to 5) divided by the average of the quintile scores for the demographic group. E.g., 5 for the diabetes indicator, 5 for obesity and 5 for Hypertension and 5 for CHD would equal 15/3 equals = 5, therefore the Early Referral Index will be 5/5=1. Thus, an ERI of above 1 = good with 1 OK and below 1 problematic.
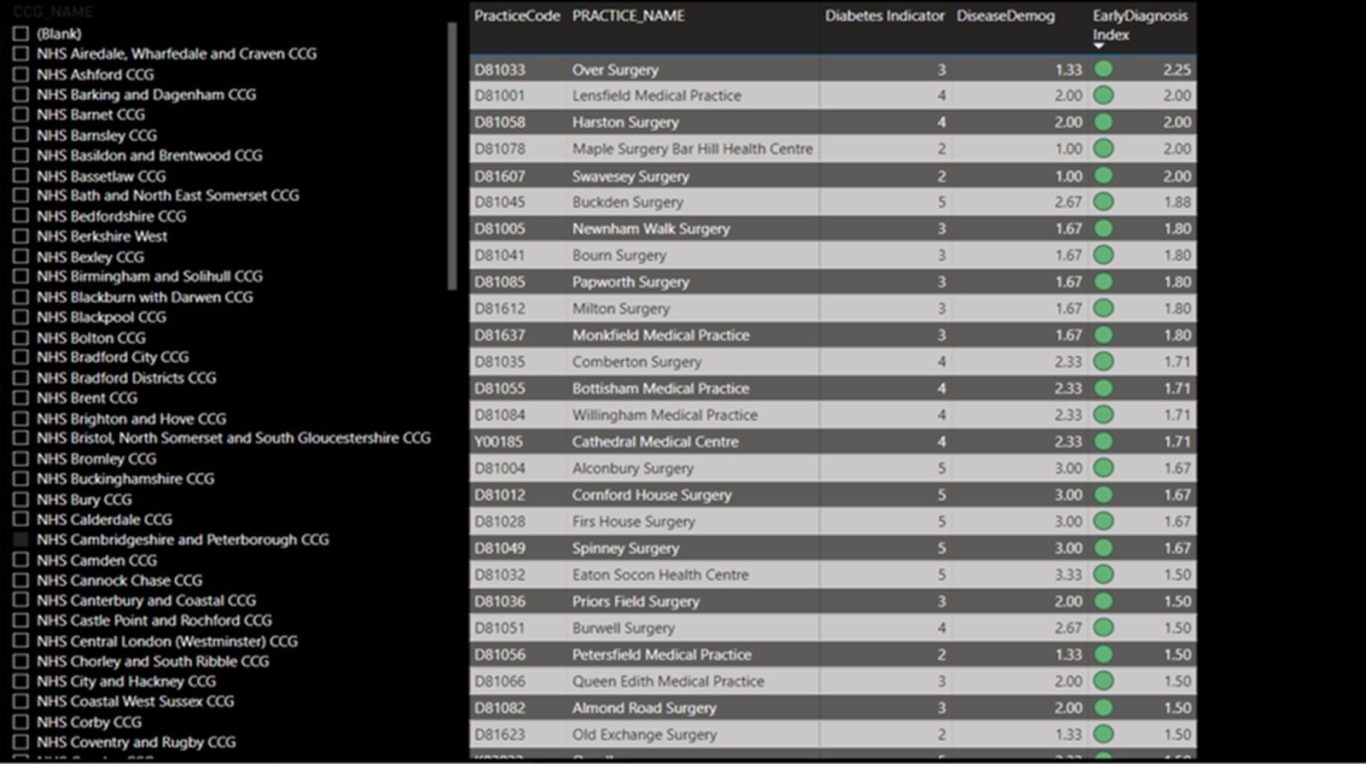
Green Practices - High Levels of Diagnosis
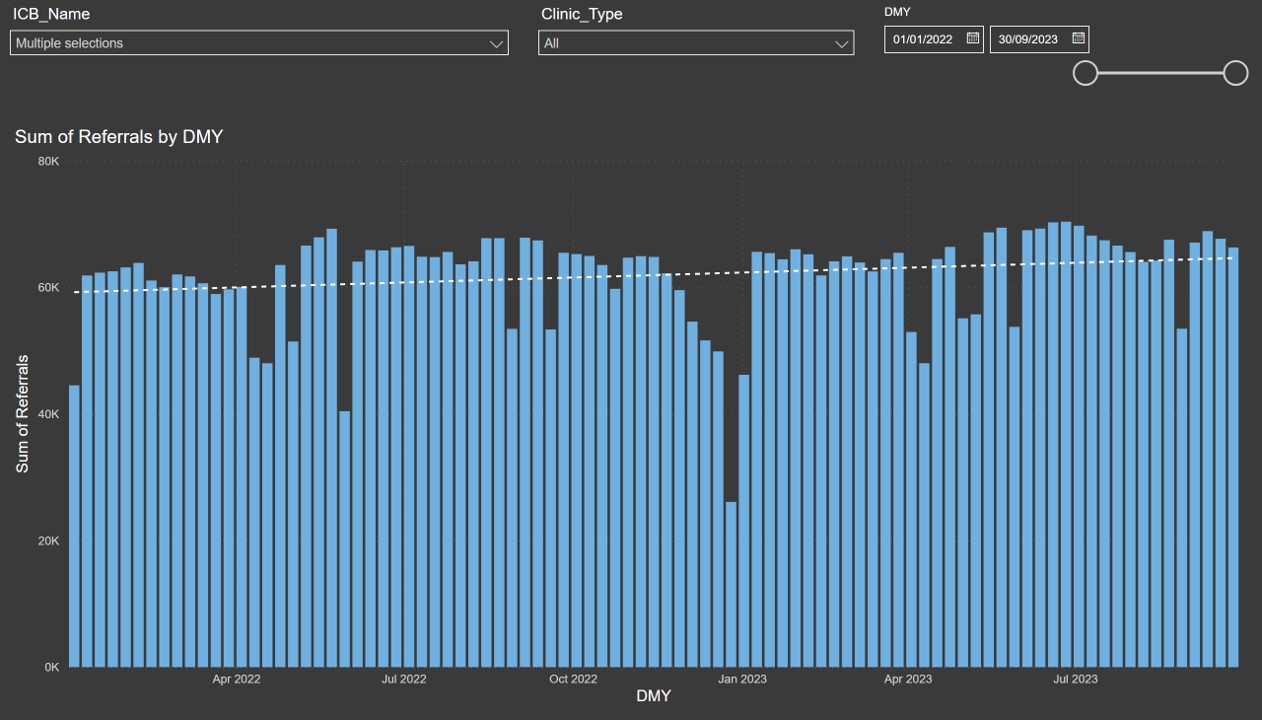
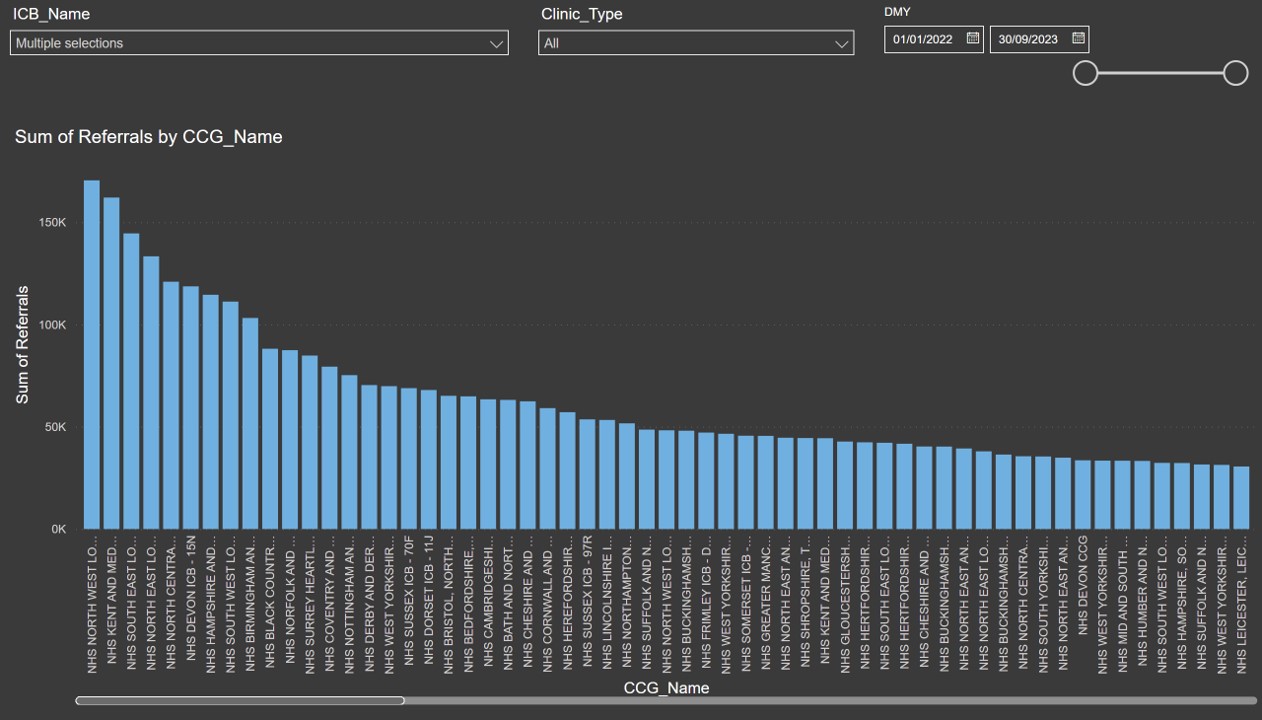
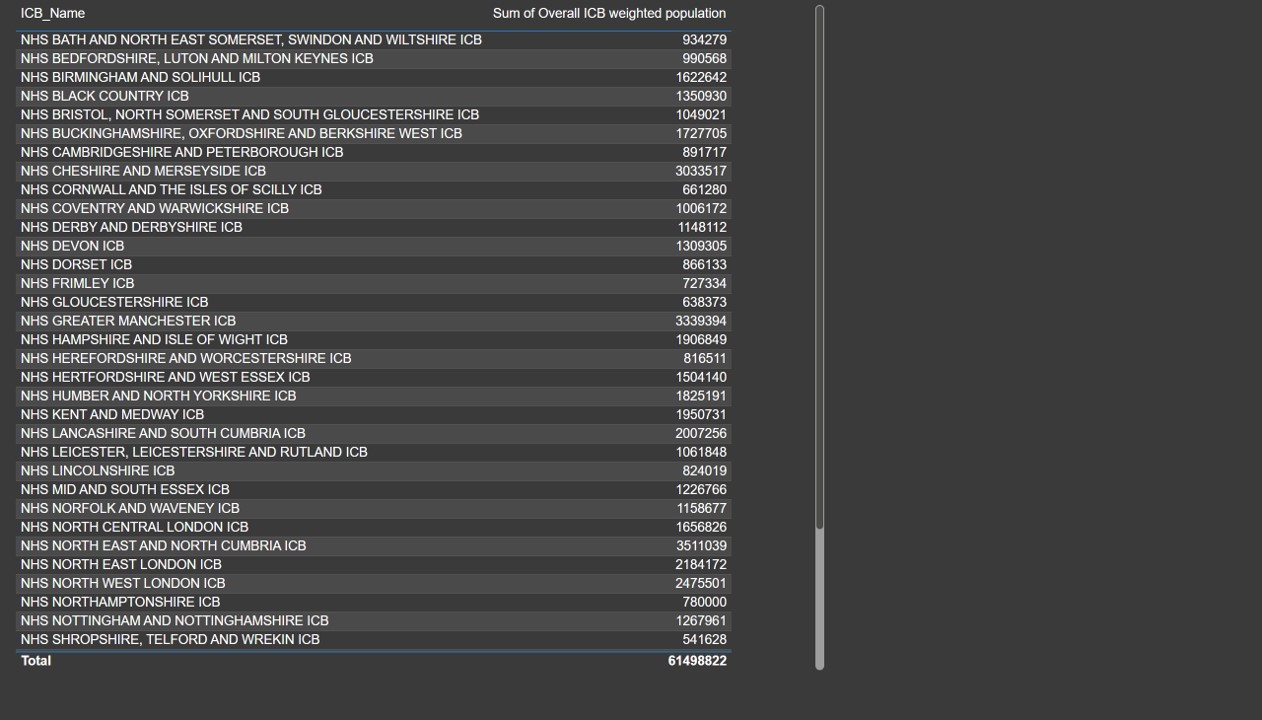
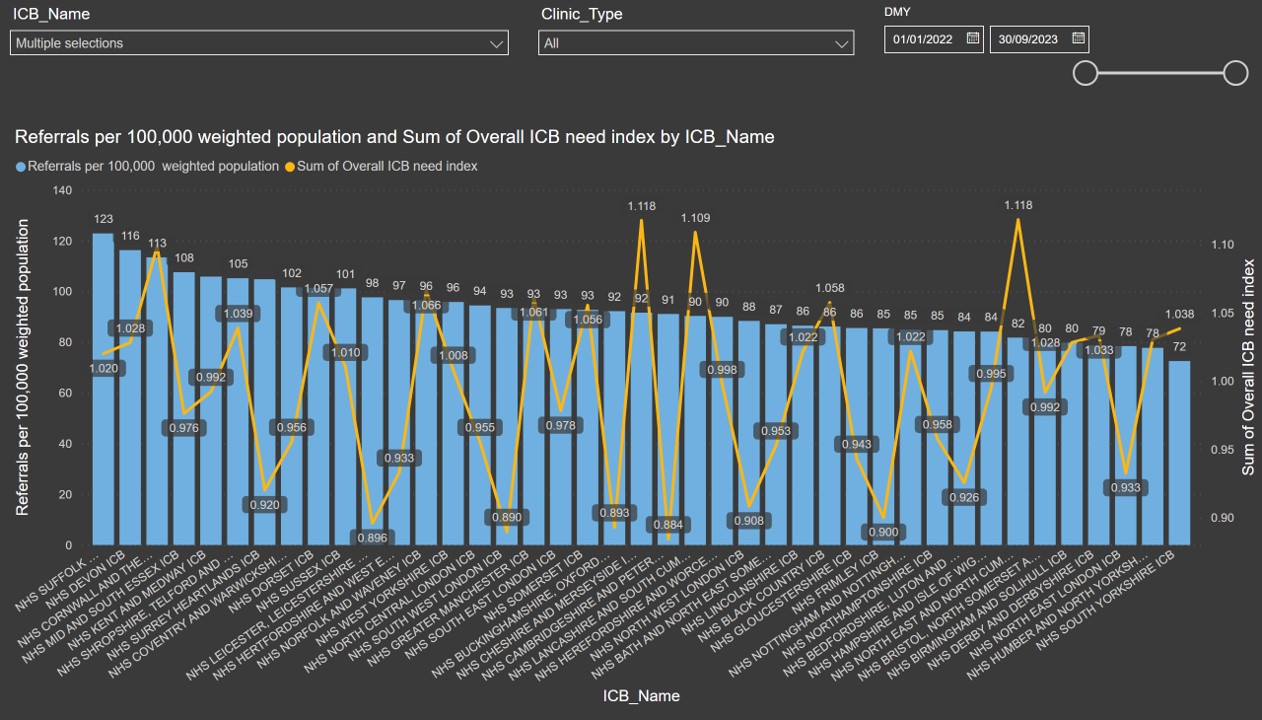
In addition to the targeting and segmentation methodology set out above, we can also use Power BI to model e-Referrals or electronic referrals for diabetic medicine by ICB and compare those referrals to their population size. Ranking ICB's accordingly also provides a good indicator of where under-diagnosis of Type 2 Diabetes exists.
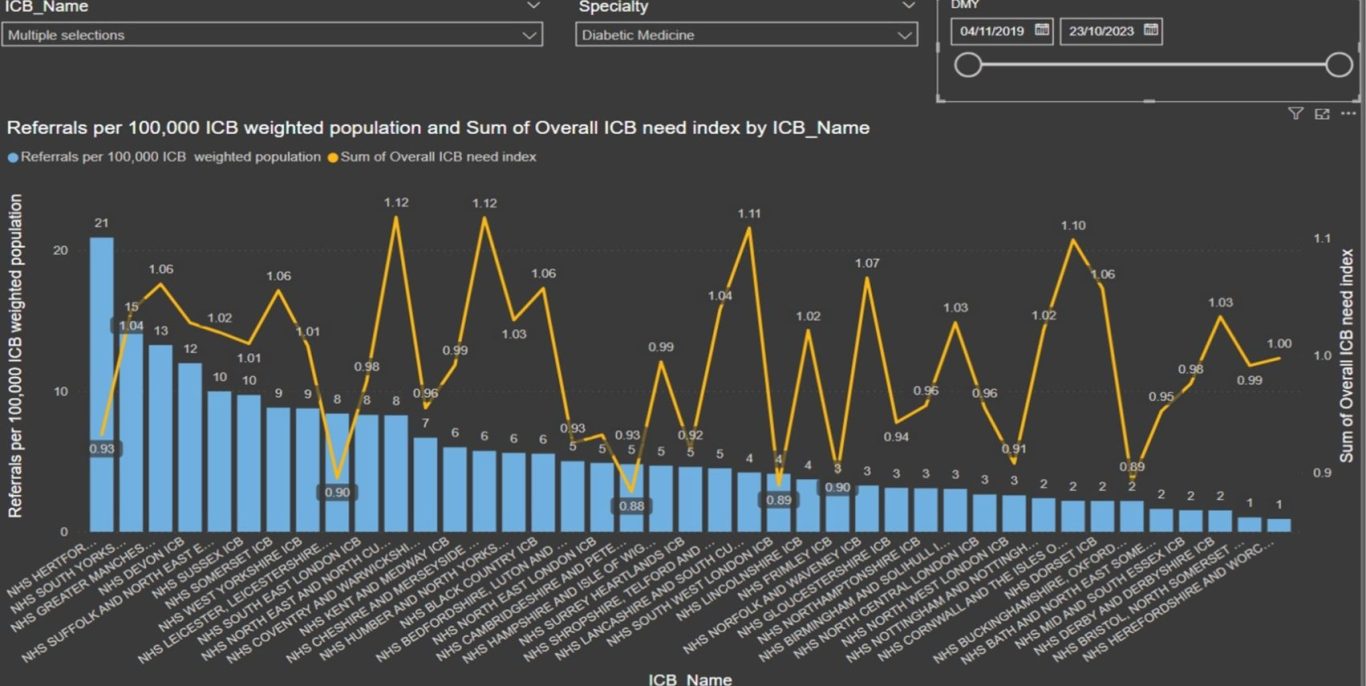
e-Referral Model - Type 2 Diabetes
This visual ranks ICB by electronic referral for diabetic medicine relative to their population
These techniques can be complemented via the inclusion of appropriate Hospital Episode Statistics (HES Data) and modelling eReferrals at GP Practice level within an Integrated Care Board (ICB)